Your Subkit Overview Dashboard simplifies how you monitor your analytics.
The Subkit Overview dashboard offers insights into how well your subscription business is doing. It can help improve your efficiencies and ultimately enhance your subscribers' experience. The following explains how each section of your account overview works.
Locate your Overview Dashboard
- To get started, locate and click Overview on the right side of your screen. By default, you should be redirected to the Overview page once you login to your Subkit account.
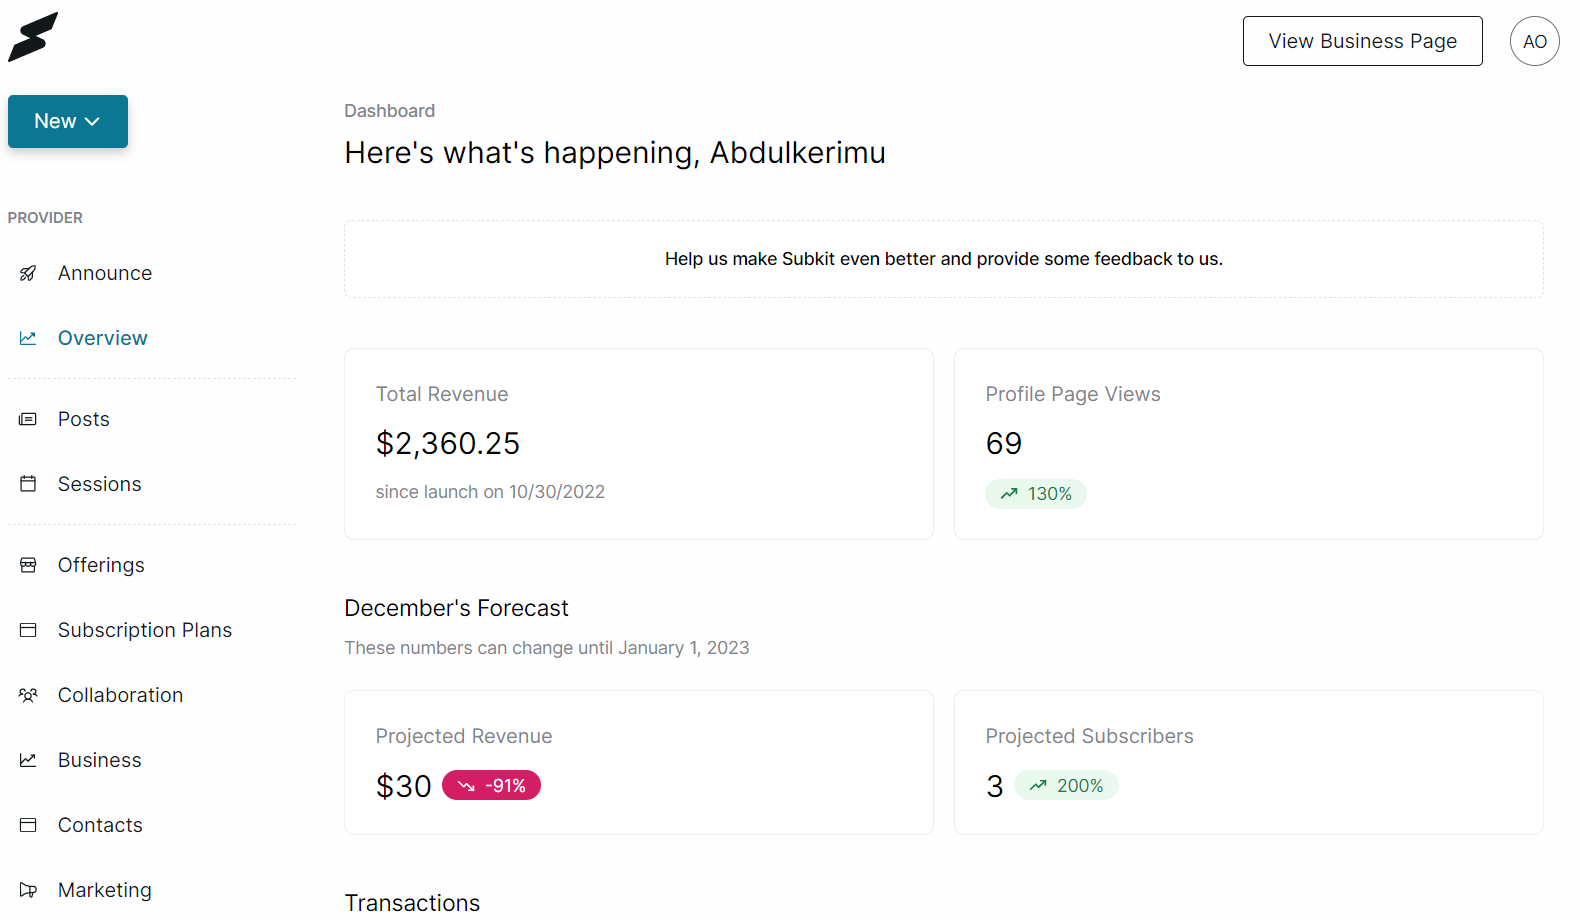
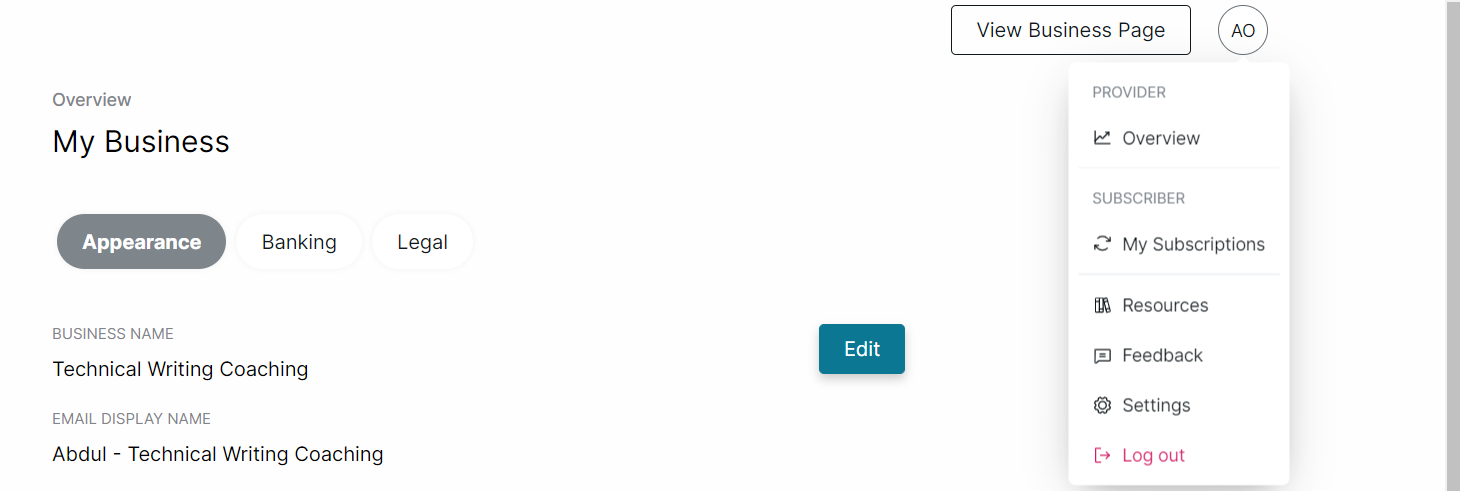
- Alternatively, you can locate and click your initials in a circle at the top right of every page. From the drop-down menu, select the Overview option.
Feedback
The first section of your Overview dashboard is for feedback. The "Help us make Subkit even better and provide some feedback to us" link takes you to a feedback and suggestions page.
Would you like to send feedback or make a suggestion? Read this.
Total Revenue
This is the total amount of money received from your subscribers. This metric helps determine how much revenue you have generated since you launched your business on Subkit.
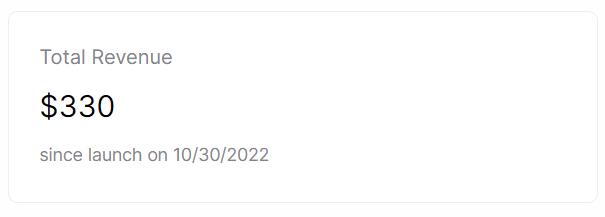
The image above shows that this Provider has made a total amount of $330 from their subscribers since they launched their business on Subkit.
Profile Page Views
This is the number of times that users have viewed your profile page. This can be an indication of how many people are interested in your profile and what you offer. It also shows the percentage increase or decreases depending on your profile views.
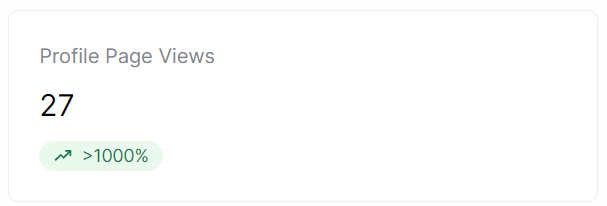
The image above shows that this Subkit Provider has 27 profile visits and a 1000% increase.
Monthly Forecast
Each month, your overview forecast analytics updates automatically. It shows you the monthly projected revenue and subscribers. This projection is based on upcoming subscribers' payments, cancellations, and refunds.

- The Projected Revenue section shows the amount of money expected from subscribers each month. this section indicates the amount and the percentage increase or decrease in your revenue.

The image above shows this Subkit Provider's total revenue for the month is $30 and is down 91% for that month.
- The Projected Subscribers section shows the total number of persons subscribed to your plan. This section shows the number of subscribers and the percentage increase or decrease.

The image above shows that this Subkit Provider has three subscribers, with a 200% increase for that month.
Transactions
This section shows the overall transaction details of all your subscribers since your business launched.
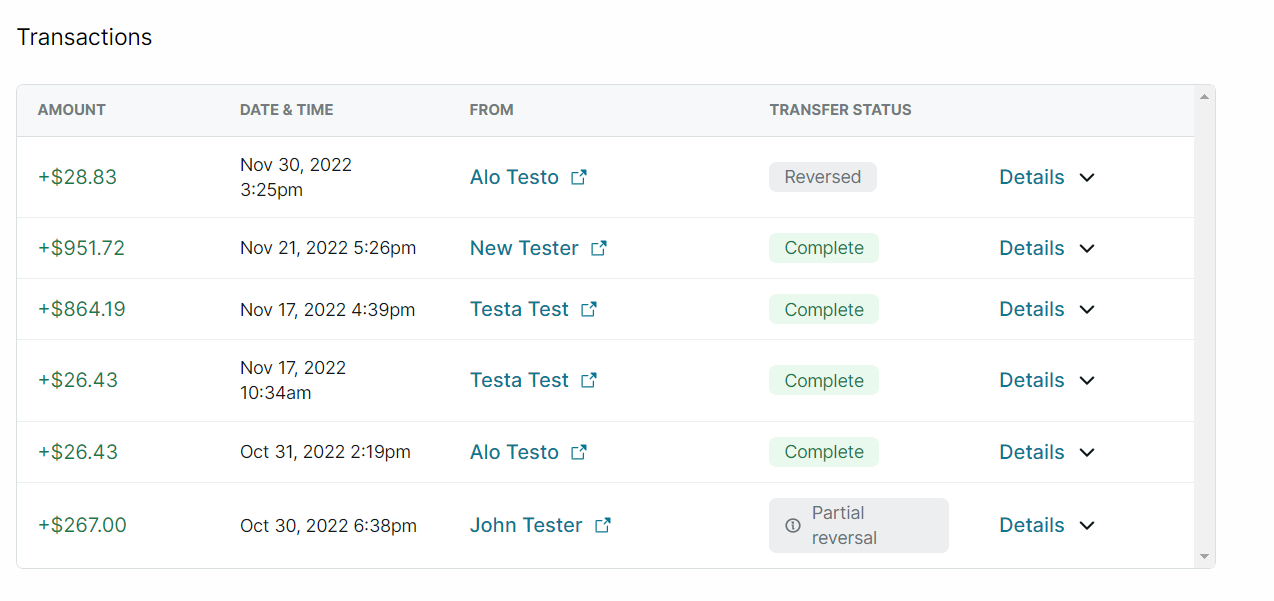
- The Amount column shows the total amount paid to the Provider (you) for each subscription.
- The Date & Time column shows each transaction's date and time.
- The From column shows the names of subscribers that made each transaction. Clicking a subscriber's name in this column will take you to the subscriber's overview page.
- The Transfer Status column shows the status of each transaction. If the transaction was successful, then the transfer status will show Complete. If you issued a refund to a subscriber, the transfer status would show Partial reversal or Reversed, depending on the amount the Provider (you) refunded.
- Clicking the Details button on the right-hand side of the transaction section will show you the payment information. Details like the total Subscription payment paid by the subscriber, the Subkit platform fee, and the Stripe transaction fee deducted from each amount made. Where a refund has been issued, it will be displayed here.

Recent Activity
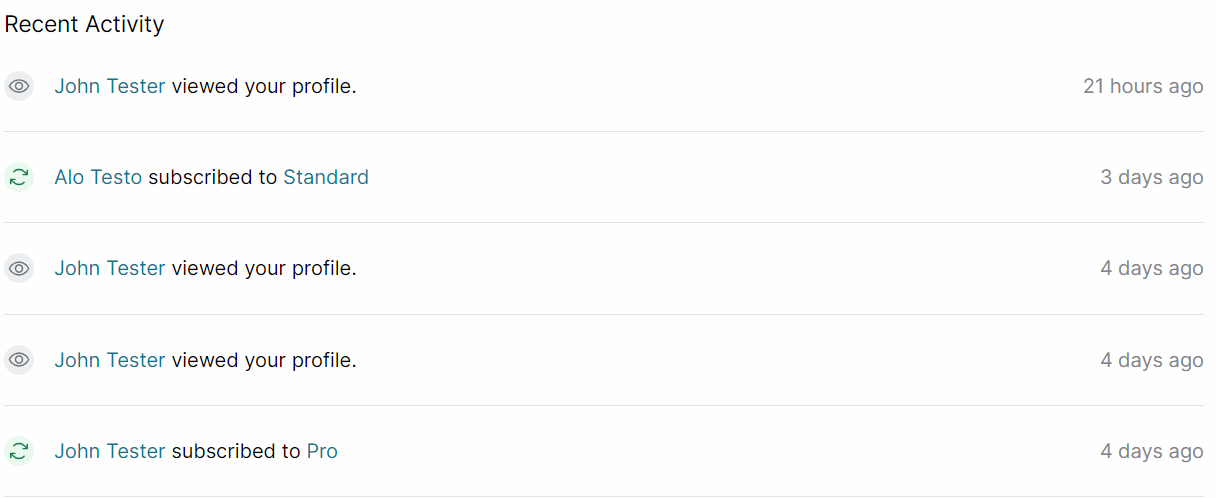
This is the last section in the Overview Dashboard. It shows all your recent updates, who is viewing your profile, new subscribers, and the plan they subscribed to. It also shows when these updates happened.
